Guide
How to Use Microsoft Excel Like a Data Analyst
![]()
Written By Jess Feldman
Last updated September 30, 2022
![]()
Written By Jess Feldman
Course Report strives to create the most trust-worthy content about coding bootcamps. Read more about Course Report’s Editorial Policy and How We Make Money.
Course Report strives to create the most trust-worthy content about coding bootcamps. Read more about Course Report’s Editorial Policy and How We Make Money.

Since 1987, Microsoft Excel has been used in virtually every office by employees with various job titles. But how is Excel used in data analysis today and can it be learned at a bootcamp? Thinkful Data Analytics Instructor Stephanie Jones explains the pros and cons of using Excel for data analysis, the top Excel functions that every data analyst needs to know, and Stephanie’s favorite free resources (and datasets) to start learning Excel!
Stephanie received a BS in Math from the University of Denver and a Master’s in Statistics from the University of South Carolina.
Stephanie has plenty of real-world experience in data too, working as a Revenue and Data Science Analyst and as a consultant for a natural language processing company that focused on AI solutions. Stephanie also helped develop a statistics curriculum for the University of South Carolina!
Her passion for teaching adult career-changers led Stephanie to become an instructor at Thinkful, where she loves the one-on-one aspect of the program and giving personalized instruction: “I was excited about the opportunity to jump into the bootcamp world because it is an adult learning space that addresses all learning types,” says Stephanie, “We support those who have test anxiety or have life situations that prevent them from turning in a homework assignment everyday. I love that and that's why I chose Thinkful.”
Excel is a spreadsheet software. Excel is a convenient go-to software that is both comprehensible and familiar, and a key part of Excel is how it can be used for ad hoc analysis. Many people are familiar with Excel and that level of comfort is where much of its power stems from.
How do Data Analysts use Excel?
Data analysts use Excel in much the same way that you might use the calculator app on your iPhone. When you aren’t sure what is going on with a dataset, putting it into Excel can bring clarity to the project.
You don’t have to be a Data Analyst by title to start using Excel, though. If you can type and hit enter, then you can start using Excel. That's the beauty of it – you can self-study and continue to learn. And with Thinkful, you have someone like me who will help you when you are stuck!
What types of data can be entered into an Excel spreadsheet?
Everyone thinks of financial data with Excel, but it can apply to any industry data – I've even worked on FDA approval cases and human resources datasets! All types of data are appropriate!
The only exception would be the size of the datasets. Small to medium-size datasets are best for Excel. If a dataset becomes too large, it's cumbersome in Excel. Many times, data analysts will take a look at the underlying data using Excel before they use a heavier application like Python or SQL.
Give us an example of a problem that a data analyst could solve with Excel!
A scheduling manager could use Excel to record their employee’s schedules. When Joe, your employee, complains about being scheduled on Friday afternoons, you can sit down with Joe and breakdown the data to see if he was being disproportionately scheduled. Using the dataset, you can offer him a straight answer with no emotion attached. That's the best part about data analytics! You receive a final answer at the end that is logical and impossible to deny.
What are the pros and cons of using Excel for data analysis?
Excel is powerful because it’s quick and easy to use, but the downside is that it isn't scalable. As data sizes become larger, we hit limits in our notebook and time limits on our computer. Excel also lacks the ability to automate processes.
Are there alternatives to Excel?
Google Sheets is a free alternative to Excel. The collaborative aspect in Google Sheets is great, but it also makes it harder to protect your data from other parts of the company. It is awesome software but Google Sheets isn’t quite as advanced as Excel is and I doubt they will ever catch up. Excel is continuously improving and expanding.
As a Business Analyst, I am typically sharing data with Tableau or Excel. If I needed someone on my team to change something, though, I would never share with Tableau. I would only be comfortable sharing with Excel, because I know my team will be comfortable working with it.
Any function that can break down data is useful for data analysts.We often hear about the Excel VLOOKUP function, which has actually been replaced by XLOOKUP within the newest version of Excel. At Thinkful, we teach students about all three of those important Excel functions, plus Index Match which is a little more difficult to master, but provides a more robust solution. Other Excel functions to break down your data include pivot tables, VLOOKUP, sorting, and filtering.
PIVOT TABLES
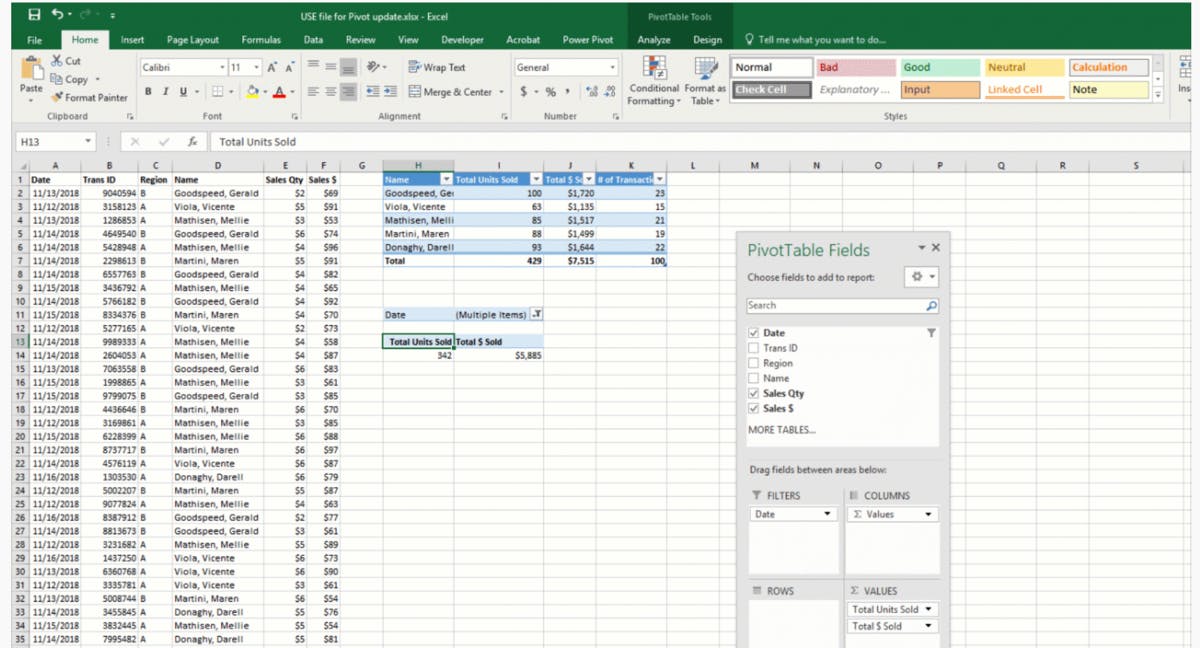
Pivot tables are a way to aggregate data to look at smaller subsets without using manual filters. Without it, you would use the manual filters on every column, check to see if they work, and then use [SUM] functions. All of that is built for you with a pivot table and pivot chart. The best part is that pivot tables are quick and easy to change. If you are in a meeting and someone wants to see 2019 instead of 2020 data, in just one click you can change the filter and all of your visualizations and pivot charts will change.
VLOOKUP
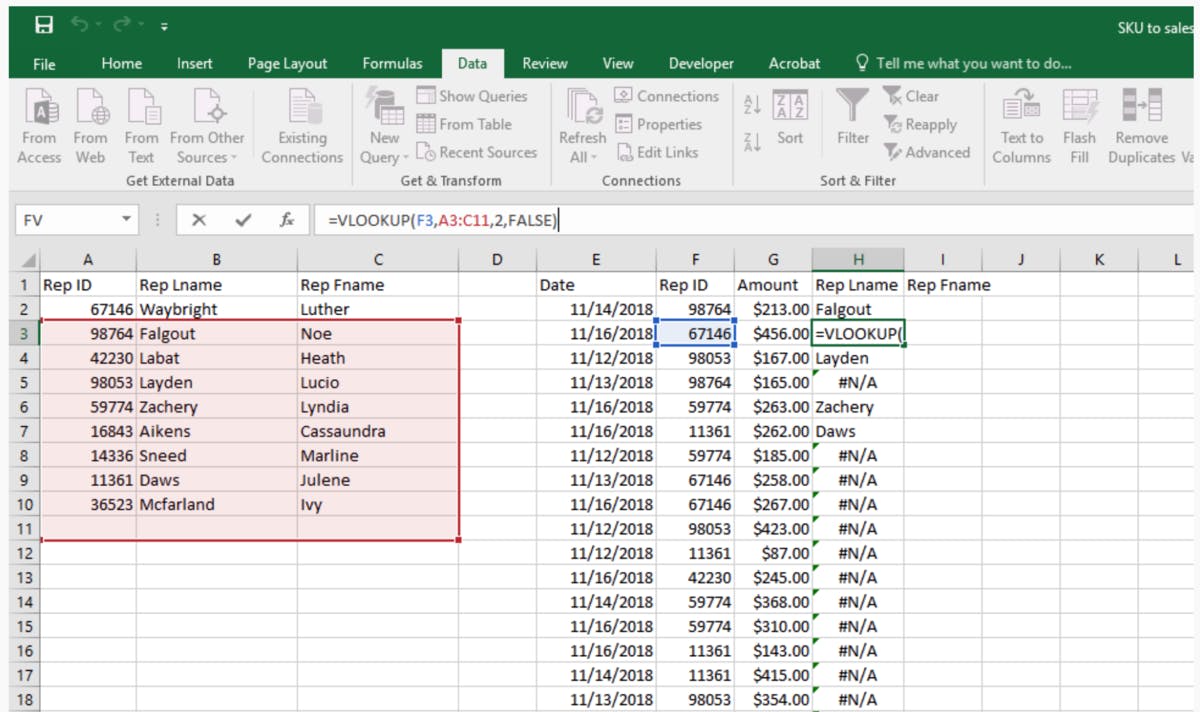
VLOOKUP is the most popular function in Excel to bring together two datasets. For instance, if you have employee numbers in one table and names in a separate table, but want to bring them together, VLOOKUP can help you do that. VLOOKUP is more accessible and logical to use when looking up a small piece of information in a dataset. If you have a larger dataset, you should use alternative methods, like XLOOKUP or Index Match. Unfortunately, Index Match is difficult for someone to learn on their own. In contrast, VLOOKUP has many detailed tutorials that can be found on the web, so you can easily teach yourself.
XLOOKUP

XLOOKUP came out in early 2020, and it was created as the solution to VLOOKUP and Index Match's problems. XLOOKUP doesn't work with past versions of Excel, but it is faster and much more user friendly. It will eventually be the industry standard, but because many people have old versions of Excel, VLOOKUP is still important to learn.
What is the Analysis ToolPak in Excel?

The Analysis ToolPak is a free add-on for Excel feature intended for the intermediate user. It allows users to do different statistical testing within their Excel notebook. With the Analysis ToolPak, you don't need to know the underlying functions for standard deviation. You can run it one time, and it will put out all of those statistics at once.
Any position with the word "analyst" at the end of it requires Excel! That includes Data Analyst, Business Analyst, Business Operations Analyst, and Reporting Analyst.
What types of projects have your Thinkful students built using Excel?
For one of our projects, students can use a dataset with housing prices for a certain neighborhood. We had just finished our Tableau section where students learned to make geographic heat maps, which is when you fill parts of the map based on frequency or quantity. One of my students wanted to learn how to use Power Maps in Excel, and together we figured out how to set that up for her.
Since you took a traditional path into data, do you think it’s possible to learn data analytics at a bootcamp?
Bootcamps are the best way to learn data analysis. I took an expensive and long education path, but my Thinkful graduates are just as qualified as me when it comes to data analytics! At the end of the day, it's about the result-based skills. Thinkful covers the theory enough to use it, but doesn't force its students to memorize the formulas like I had to in a university. Students learn where to find the information and how to use the resources they will have on a job, such as the Thinkful resources on their dashboard (which they will have access to forever). I had to learn these skills on the job with my boss breathing down my neck and a coworker doing the other half of the project. It was stressful, made me feel like an imposter, and created self-doubt. In contrast, Thinkful students receive hands-on work experience throughout the bootcamp. They can be comfortable asking questions and finding solutions in a positive environment. At Thinkful, there is pressure on students to cover the material, but never to learn anything on their own. I tell my students that struggling for more than 20 minutes is not a good use of their time. They need to ask for help.
How does Thinkful’s data analytics bootcamp incorporate Excel into the curriculum?
Excel is taught throughout the entire data analytics curriculum. Any skill that we build, we build first in Excel, and then we discuss other features and ways to access data outside of Excel. We always relate it back. For example, I teach the Python section of the curriculum. As soon as we hit the Pandas section, I ask students what the Pandas dataframe looks like. The answer is, it's a spreadsheet, which means we are right back to Excel again! Everything connects back to Excel because of the comfort-level. It doesn't mean that it is the easiest, best, or scaleable way, but it's a good place to start.
Can you teach yourself Excel?
Excel has official and unofficial documentation plus tutorials everywhere online. Excel and information about the software is so ubiquitous because it's been around for so long. It's very easy to find the answer for anything you want to do in Excel because there is always someone who has done it before and documented it.
For Excel newbies, what resources do you recommend?
Check out Microsoft Excel’s support page for great documentation.
Thinkful offers a Data Analytics prep course that our students may take before the bootcamp begins. It fully prepares the student to begin the Data Analytics immersive program. When a student doesn’t go through the free prep course work, they ask many questions the pre-work explains and that slows down the class.
If you’re looking for data, head to Kaggle. You can also review on people’s projects on there, too!
To practice with Excel, you need data! Where do you recommend finding sample Excel data?
Data.gov has a ton of datasets to play with.
As a statistician, I recommend Nate Silver FiveThirtyEight who publishes their datasets and some of the code. You can read the article and then review the dataset and code to run it yourself. It's helpful if you want to learn some of the techniques they use.
The best place to find data is within your everyday life, such as finances, credit card statements, and work schedules. Your home and work life has familiar and comfortable data to work with, so you’ll quickly know if something in your dataset isn’t correct!
Microsoft Excel has been for a very long time. Do you see Excel retaining its importance in the future of the tech workforce?
We will always have Excel in data analysis, but it's role is already changing. Websites like Amazon collect the data of every click, which means huge datasets. As we get bigger datasets, it won't be feasible to apply them to Excel. Microsoft will ultimately adapt with better software to handle larger loads, but Excel will not change much. It also won’t go away because we teach it to students as early as middle school. Everyone has a basic understanding of its processes and uses it at a basic level in the workplace. Analysts will utilize Jupyter Notebook or Python code for big data projects, but the majority of the workforce will still be reading Excel spreadsheets.
Find out more and read Thinkful reviews on Course Report. This article was produced by the Course Report team in partnership with Thinkful.

Jess Feldman, Content Manager at Course Report
Jess Feldman is an accomplished writer and the Content Manager at Course Report, the leading platform for career changers who are exploring coding bootcamps. With a background in writing, teaching, and social media management, Jess plays a pivotal role in helping Course Report readers make informed decisions about their educational journey.


Enter your email to join our newsletter community.